Circuit Tools
Advanced Race Analysis, Made Effortless
Designed by racing drivers, it makes it easy to review laps, compare performance, and uncover where time can be gained – without the complexity of traditional data tools.
Features

Fastest & Ideal Laps
Quickly spot where time can be gained. Automatically display your fastest lap, or generate an ideal lap from the best sectors across multiple sessions.

Laps & Sector Comparisons
See exactly where you're gaining or losing time with delta time between laps and split-sector analysis. Spot inconsistencies, refine your technique, and drive more consistently lap after lap.

Side-by-Side Video
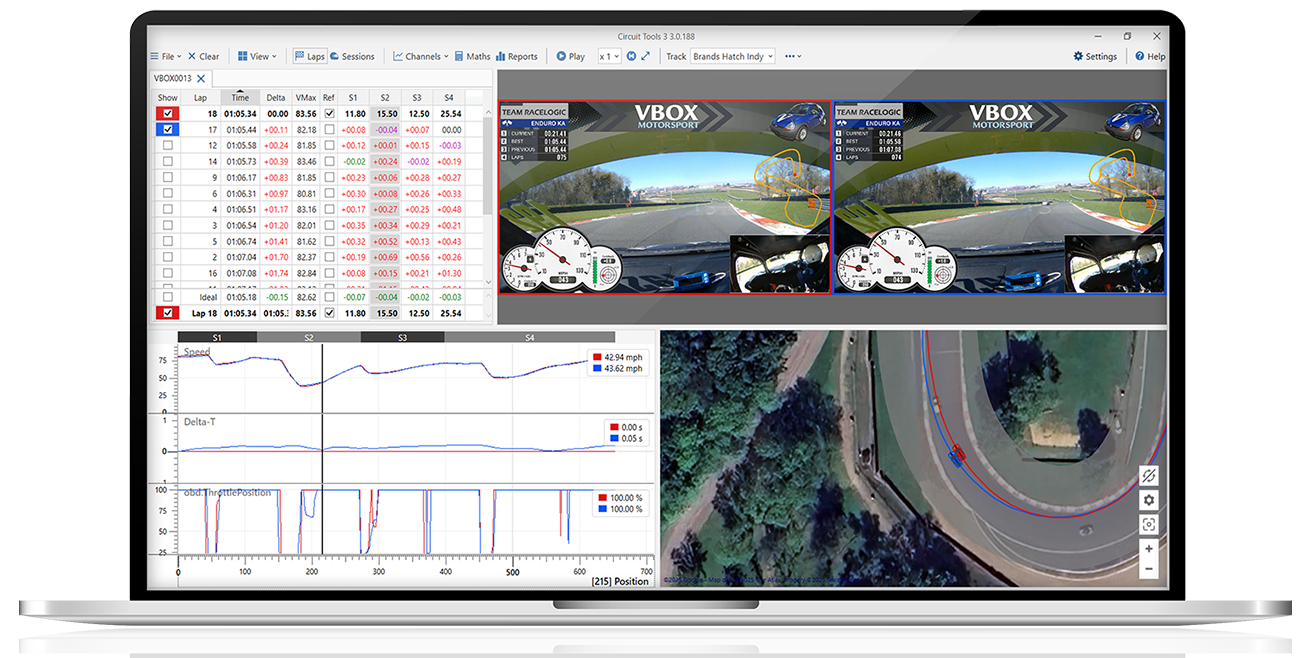
Visually compare braking zones, throttle pickups, and cornering techniques across laps or drivers. Videos are fully synchronized with your data and can be reviewed in slow motion, one frame at a time – making it easy to spot performance differences with precision.

Satellite Track Map & Overhead Car View
See your racing lines like never before. Satellite imagery adds real-world context and reference points to your data, while the new Overhead car view makes lap comparisons easier to understand visually.

Intuitive and Fast
Sleek, modern, and built for speed. Sharp visuals and an intuitive drag-and-drop function make it easy to compare multiple data channels on a single axis, while automated routine tasks deliver the critical insights you need – fast.

Engineering-Grade Insights
Create custom data with maths channels or use built-in metrics like coasting and understeer. Spot trends instantly with histogram reports for faster, smarter decisions.

Auto Circuit Detection
Circuit Tools automatically detects the country, circuit and track configuration from a comprehensive database of race circuits.

Absolutely Free
Circuit Tools is completely free to download and use, with no subscriptions or paywalls. It includes example data so you can explore its features right away.
NEW: Circuit Tools 3
Faster, smarter, and more powerful than ever, Circuit Tools 3 for Windows is the next generation of video and data analysis software for motorsport.
Rebuilt from the ground up with a streamlined interface and powerful new features – including histograms, maths channels, and improved visual reporting – it gives drivers, coaches, and engineers everything they need to unlock performance on track, without getting lost in complexity.
Circuit Tools for Windows
Circuit Tools has been designed by racing drivers, for racing drivers, to quickly provide information that is key to improving lap times.
Click on the blue markers to find out more.
Fastest Lap & Ideal Lap
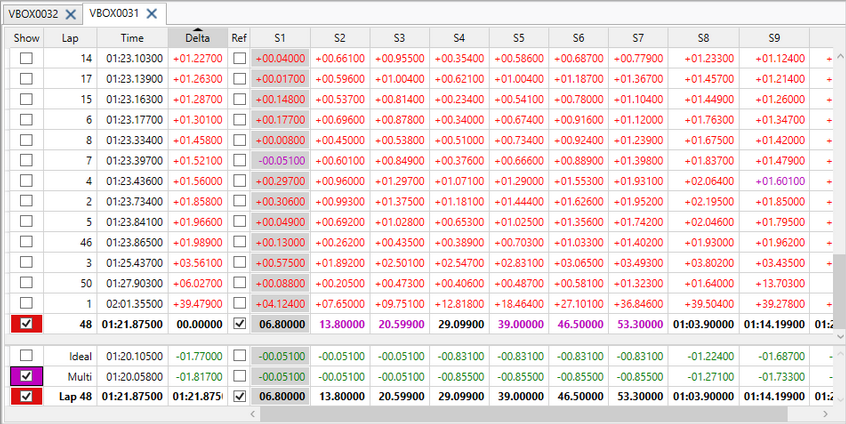
The Fastest Lap from your latest session is automatically chosen as the reference and displayed in bold.
You can also view an Ideal Lap, built from the fastest sector times in that session.
New: Combine the best sectors from all sessions to create and display a Multi Lap.
Enhanced Data Graphs
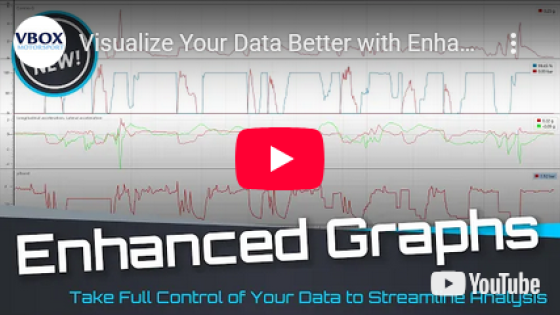
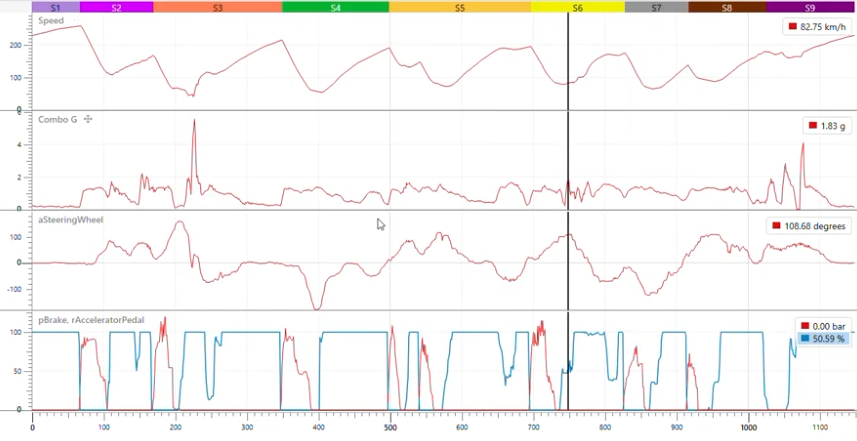
Improved data graphs offer greater clarity and sharpness, plus an intuitive drag-and-drop function to consolidate multiple data channels onto a single axis.
Colours can be customised for each data set for easier differentiation.

Comparing Laps & Sectors
Track time delta visually while watching both laps unfold frame-by-frame.
Visually compare braking zones, throttle pickups, and cornering techniques across laps or drivers.

Side-by-Side Video
Video is fully synchronised with your data, making it easy to match driver inputs to on-track actions.
Track time delta visually while watching both laps unfold frame-by-frame.
Visually compare braking zones, throttle pickups, and cornering techniques across laps or drivers.
Compare laps from different sessions, drivers, or setups side by side.
Satellite Track Map & Overhead Car View
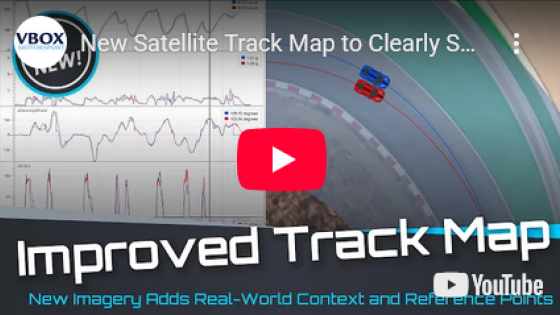
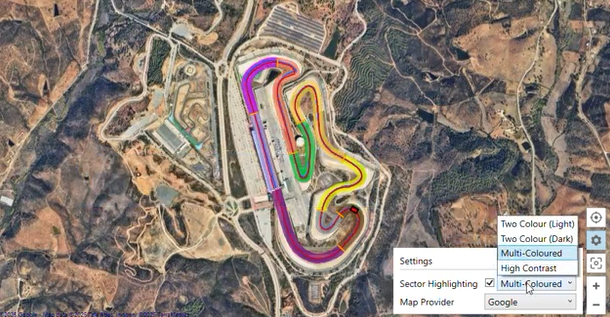
See your racing lines like never before.
Satellite imagery adds real-world context to your data, while the new Overhead Car View makes lap comparisons easier to understand.
Sector highlighting further breaks down each lap, making differences by segment easy to spot.
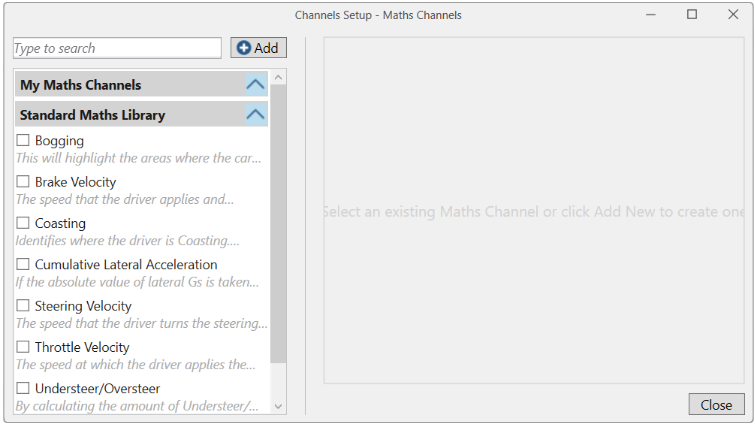
Math Channels
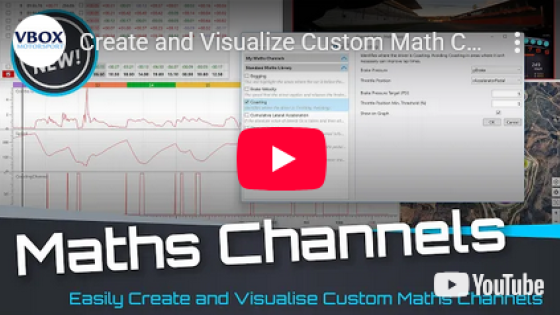
Build and visualise custom data with flexible maths channels, or get started quickly using our built-in library for channels such as coasting, bogging, throttle velocity and understeer /oversteer.
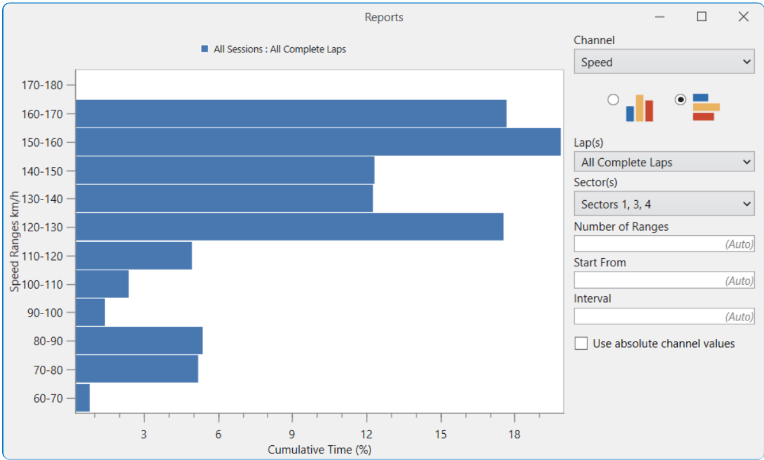
Histogram Reports
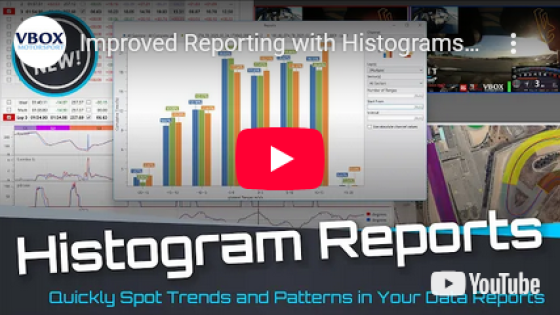
Quickly spot trends and patterns in your data with new report features designed for fast, visual analysis at a glance.
Circuit Tools for Apple Devices
Circuit Tools iOS will run on any Apple device with iOS version 8.4 or later installed.
The app can also analyse data without video from Racelogic's other data loggers including VBOX Touch,
Video VBOX and VBOX Sport.

Lap Times
The best lap from any loaded session as well as an 'ideal' lap created from the best of each
sector time across the session will be displayed at the bottom of the screen. By default,
the fastest lap will be selected. A second lap can then be chosen to compare against.

Map
The map pane shows both the circuit overlay and the line taken by the selected lap(s).

Video
A video for each selected lap is shown.
The faster lap will have a green border whilst the slower lap has a red border.

Data Graph
loaded, the fastest lap from each file will be automatically selected for comparison.

Loading Data
and the following Wi-Fi SD card readers:
RAVPower FileHub Plus RP-WD03
RAVPower FileHub Wireless Travel Router RP-WD007
Toshiba Canvio AeroMobile wireless SSD
Data files can be loaded into the app via Dropbox.
Circuit Tools macOS is very powerful analysis software that
allows you to examine your track performance on your MacBook or iMac (operating on macOS 10.12 and higher).
Analysis of every brake or turn-in point is easily achieved using the simple yet dynamic interface.

Lap Times
Your Fastest Lap number is highlighted automatically in Green, whilst the fastest times
from each section are shown at the base of the table indicating your ‘Ideal’ lap time.

Graph Data
The graph allows channel data for the selected laps to be compared. A colored bar at the
top of the graph shows where each split is in relation to the graph data.

Video
A video for the selected laps are shown. The faster lap has a Green border.

Map
The Map pane shows both the circuit layout and the line taken in the selected laps.
Each split is designated a colour making it easier to reference the data within the graph.

Sample Data
Watch this video and download the accompanying video and data files for replay in Circuit Tools.

