Performance Box Touch
Touch screen performance meter with live slope correction, lap timer and speed display.
4.3” color touchscreen
Performance, lap timing & speed display
25 Hz GPS data logging
Up to 6 hrs battery lifetime
Powerful data analysis software
Inbuilt GPS antenna
Features

Large Touch Screen

Live Slope Correction
The slope correct function for accel tests will correct the acceleration time result relative to the gradient the test was performed on and display the result live on screen.

6hr Battery Life Time

Made in Britain
VBOX products are designed and manufactured in the UK. We take pride in our commitment to excellence, ensuring top-notch quality in every aspect of our products.


Inbuilt GNSS Antenna
25 Hz GNSS receiver with internal patch antenna and optional external GNSS antenna (overrides the internal antenna when connected)

SD Card Logging
Operation Modes
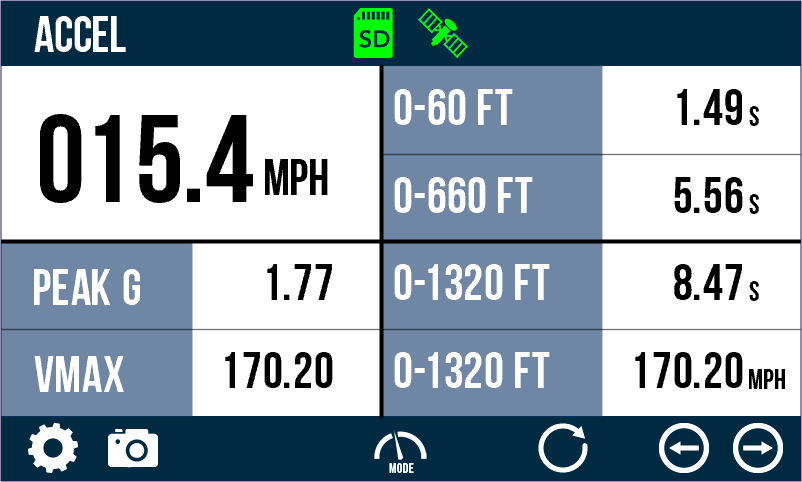
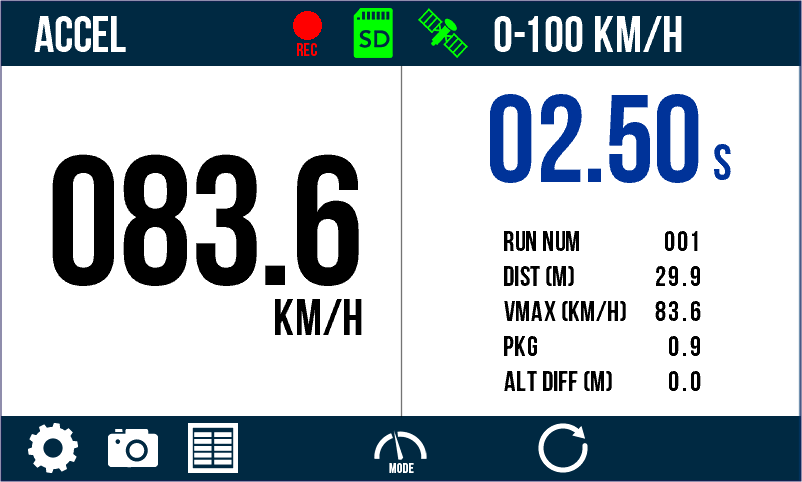
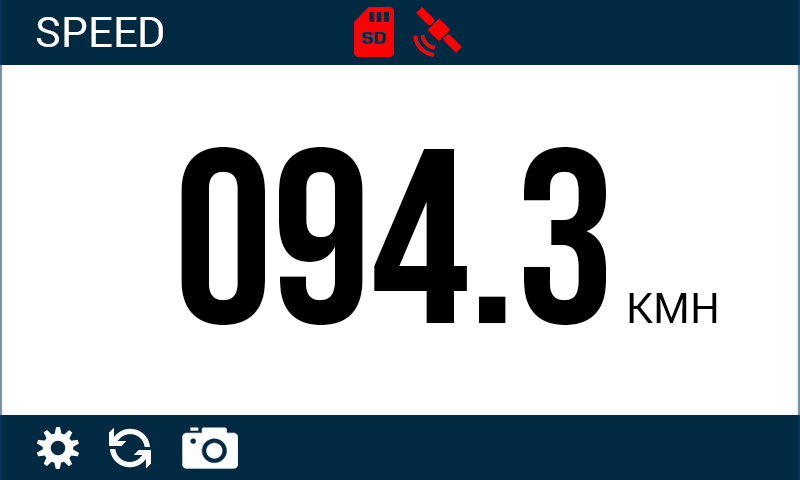
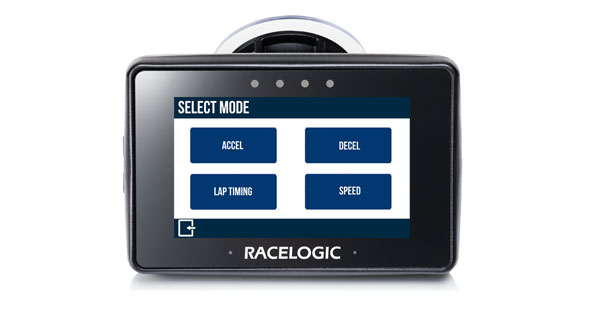
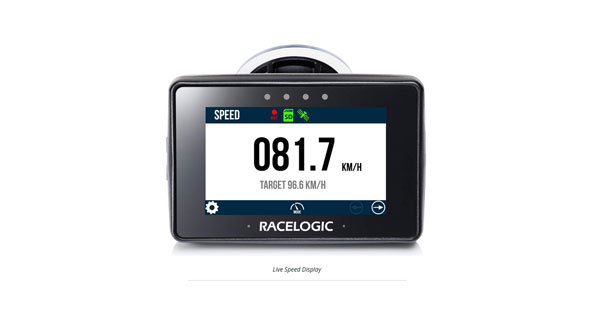
Performance Box Touch has 4 modes available which allow you to conduct a range of performance tests and functions: Acceleration, Deceleration, Lap Time and Speed.
Acceleration Testing
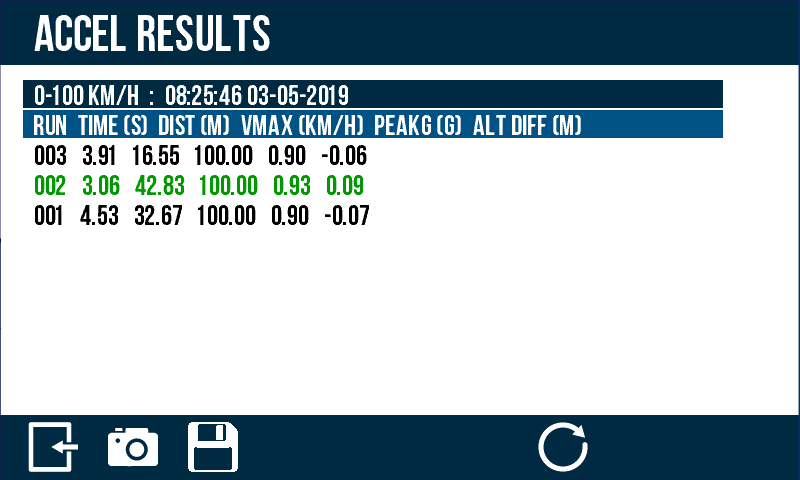
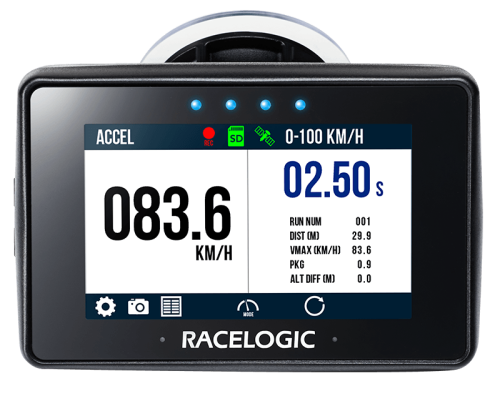
- Acceleration tests: 0–60, 0–100, 100–200 km/h or mph.
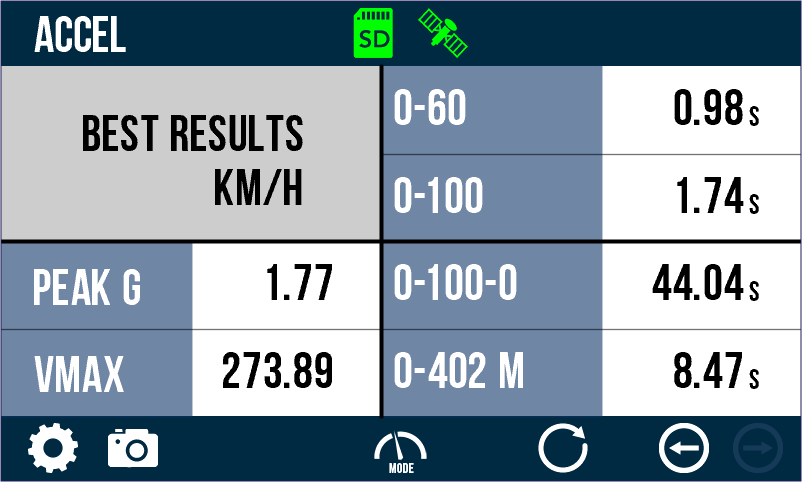
- Concurrent acceleration tests: Since firmware 1.4, it is possible to conduct four concurrent acceleration tests, visible via two new acceleration screens - Secondary and Best Results.
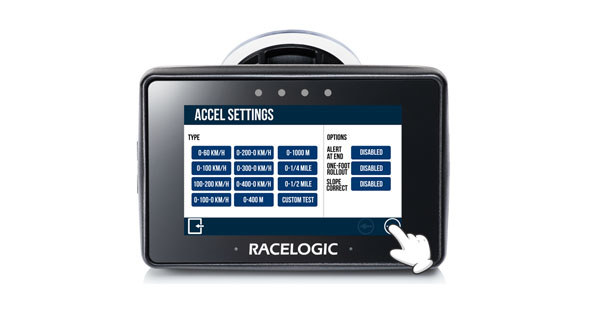
- Other predefined tests: 0–100–0, 0–200–0, 0–300-0 and 0–400-0 km/h or mph tests or distance including 0–400 and 0–1000 meters as well as 0–¼ mile and 0–½ mile.
- Custom tests can be configured, and other options include enabling or disabling alert at end of test, one-foot rollout and slope correction.
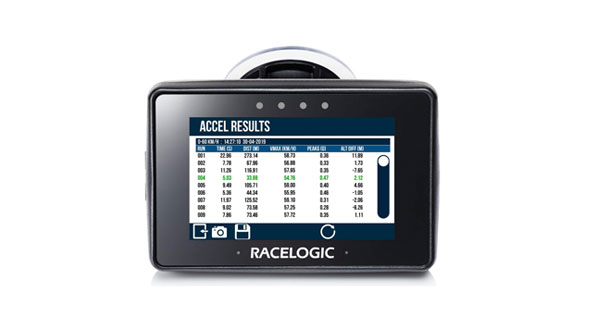
- Screen displays time, run number, distance, VMAX, Peak G and altitude difference.
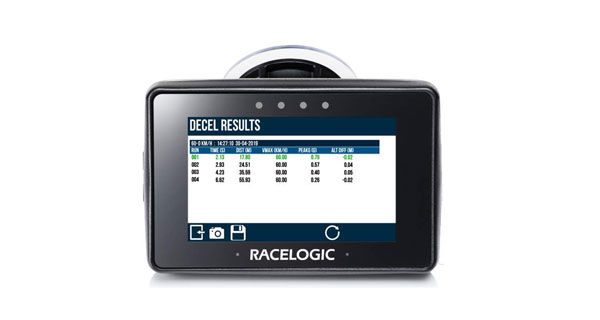
Deceleration Testing
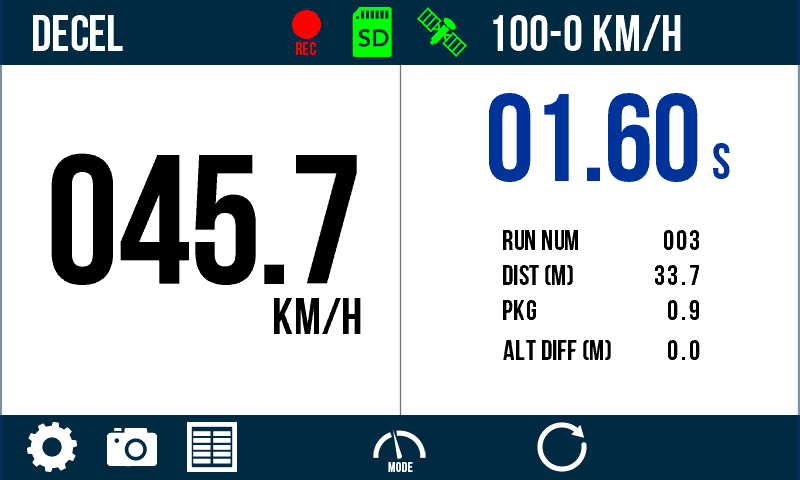
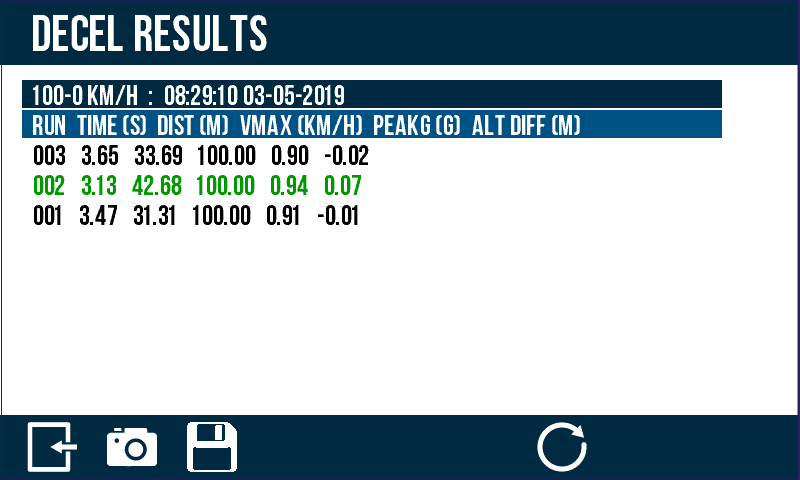
- Deceleration tests: 60-0, 100-0, 200–0, 300–0 km/h or mph.
- Custom tests, allowing the user to define their own configurable settings.
- Screen displays time, run number, distance, Peak G and altitude difference. Units of measurement for speed or distance can be displayed in metric or imperial and easily swapped between.
Delta -T Main
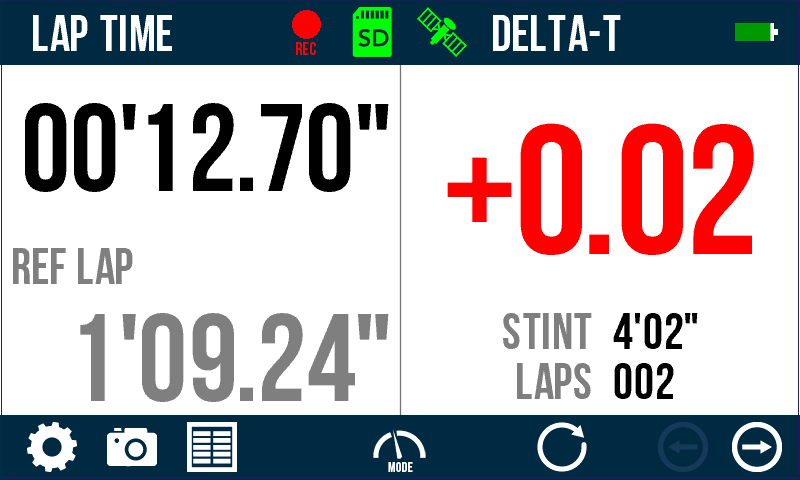
Delta -T Main
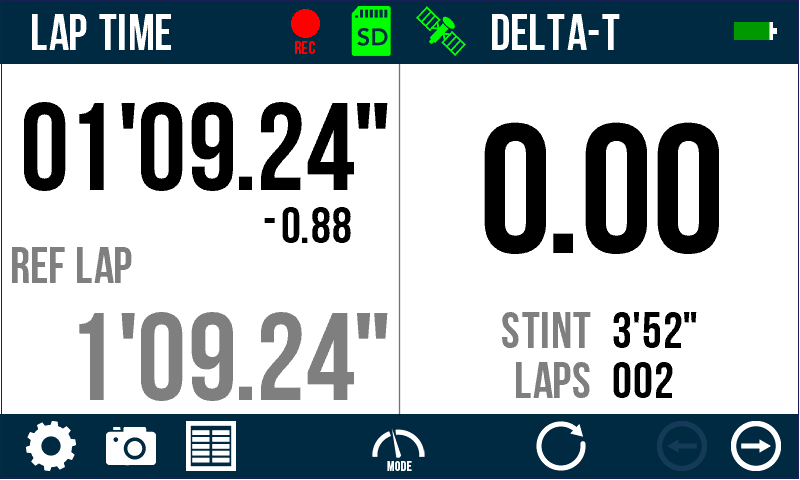
Delta -T Main
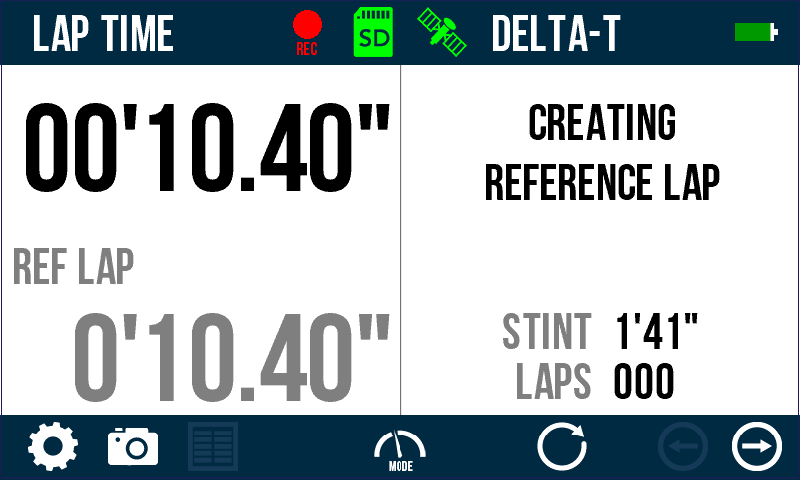
Creating Reference Lap
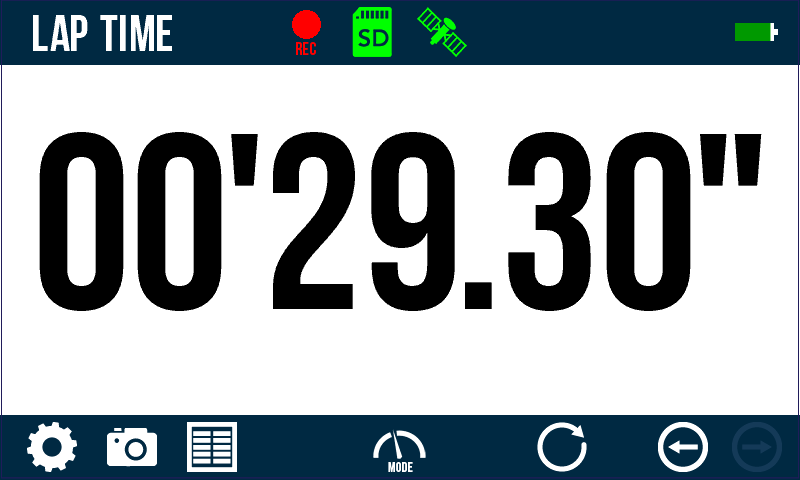
Static Lap Time
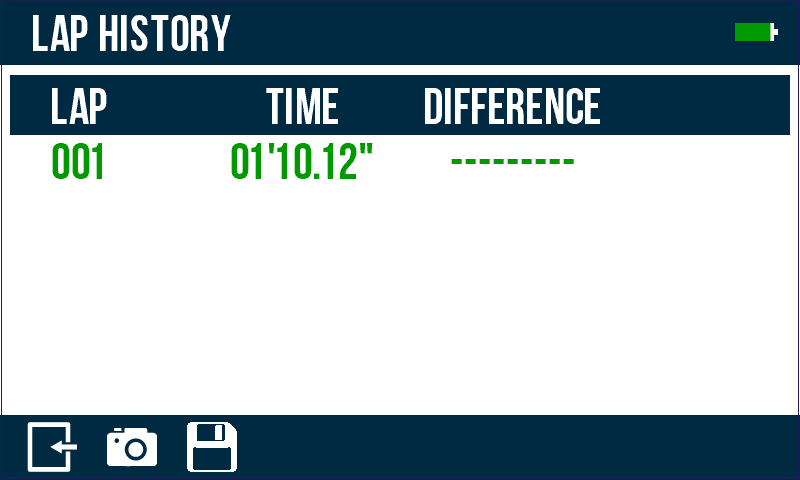
Lap History
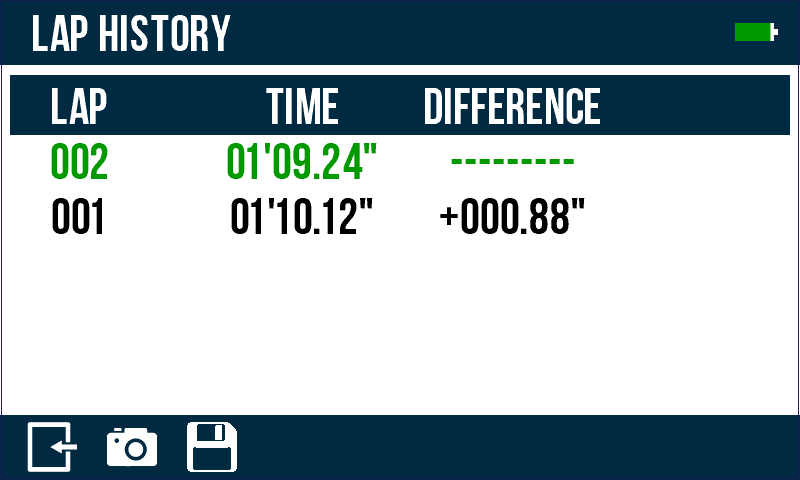
Lap History
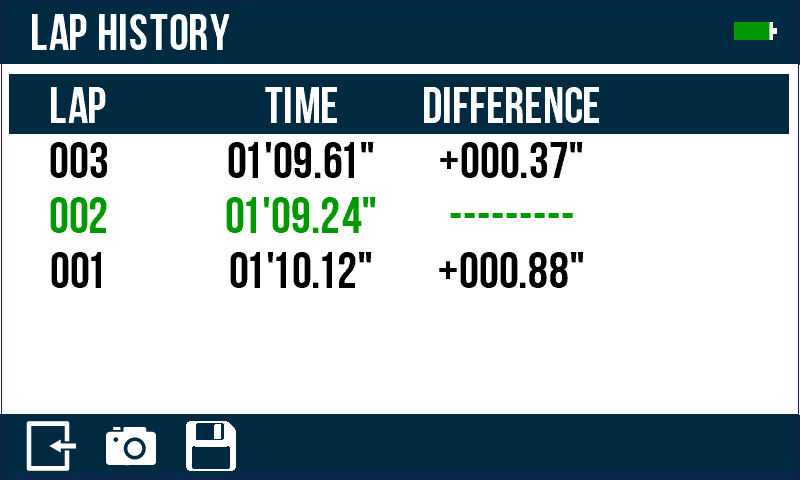
Lap History
Lap Timing
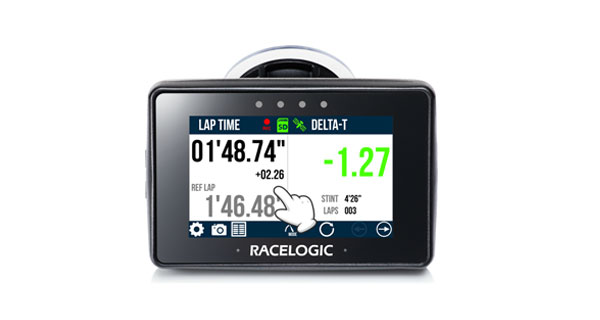
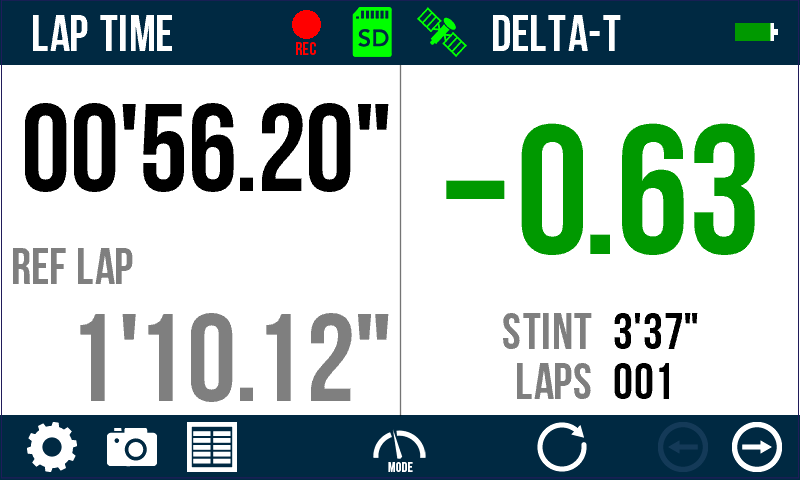
Sophisticated lap timer with an updatable built-in database of over 800 circuits, real-time Delta-time, Delta-speed (shown via LEDs), Best Lap Time, Current Lap Time, Total Session Time and Lap Count.
Virtual Start/Finish Lines: Using GPS, there is no need for an external beacon or transmitter, as timing will start with vehicle movement. Separate start and finish lines can be set for sprint or hill climbing.
Powerful Circuit Analysis Software
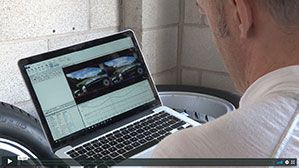
Each Performance Box Touch is supplied with an SD card containing the VBOX Test Suite and Circuit Tools software.
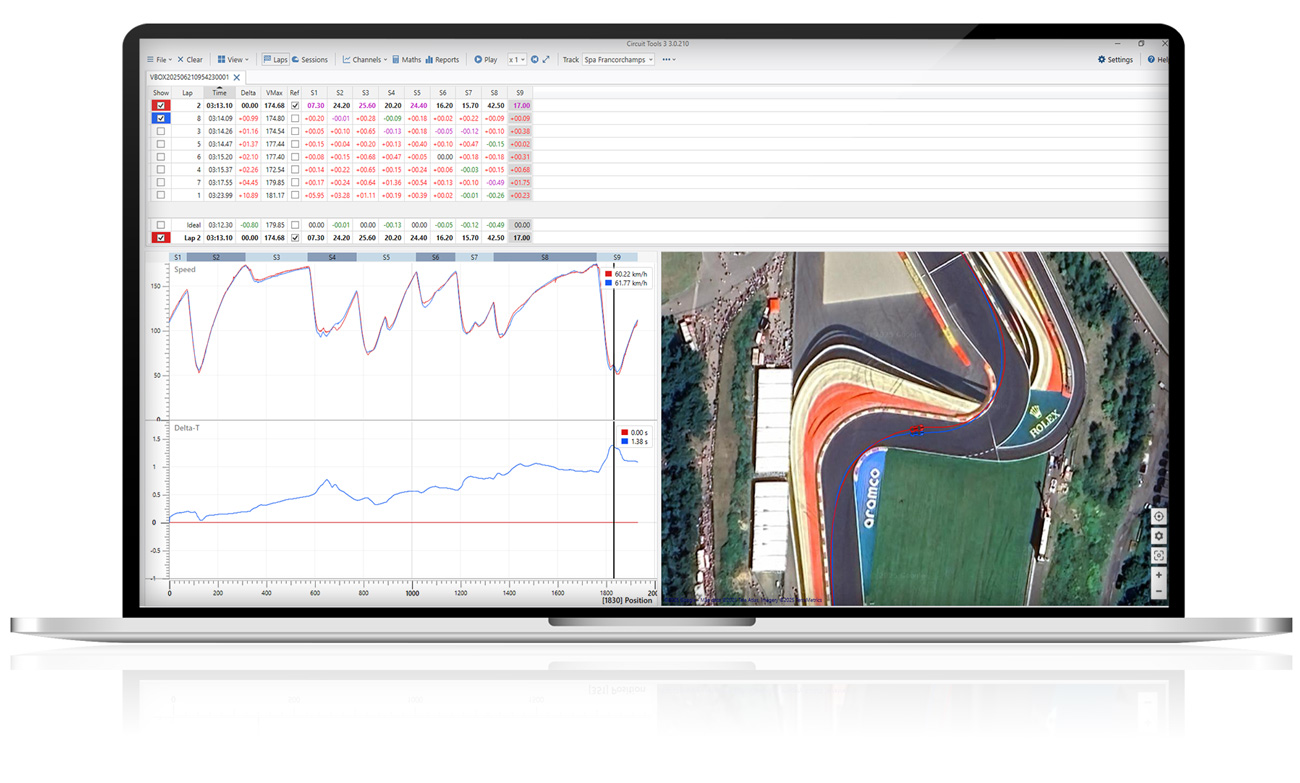
Circuit Tools is designed by racing drivers for racing drivers, with none of the complexity normally associated with data analysis software.
The software will automate many tasks and give you all the information required to improve lap times.
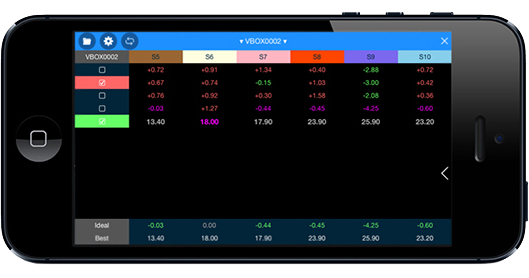
Watch this video and download the accompanying video and data files for replay in Circuit Tools.
Fastest Lap & Ideal Lap
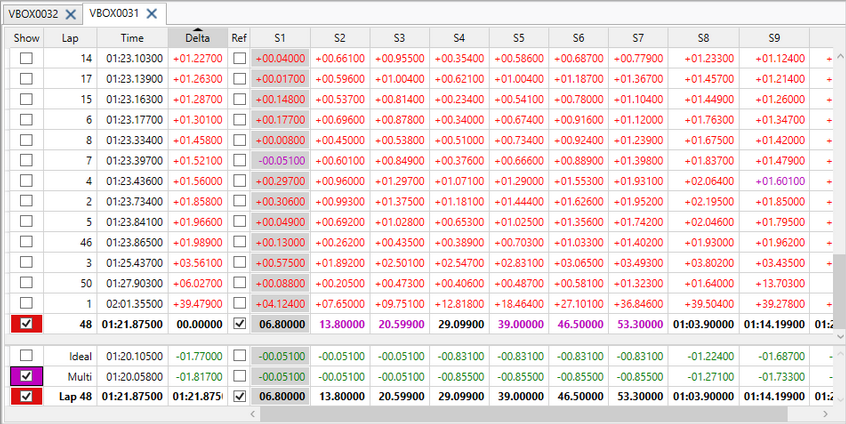
The Fastest Lap from your latest session is automatically chosen as the reference and displayed in bold.
You can also view an Ideal Lap, built from the fastest sector times in that session.
New: Combine the best sectors from all sessions to create and display a Multi Lap.
Enhanced Data Graphs
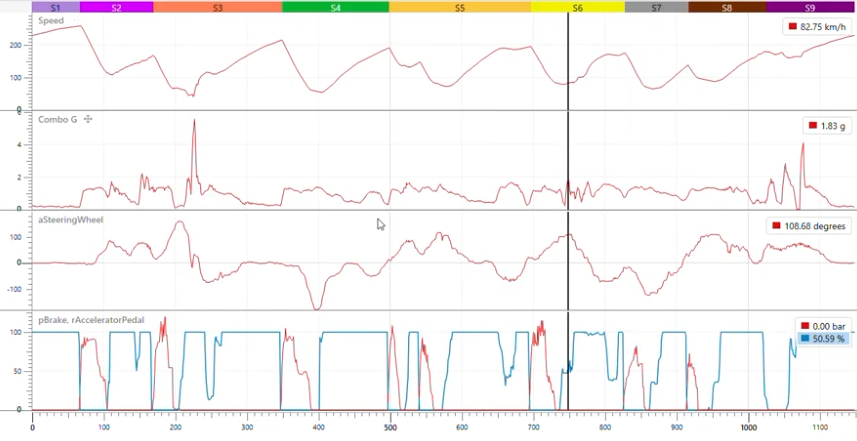
Improved data graphs offer greater clarity and sharpness, plus an intuitive drag-and-drop function to consolidate multiple data channels onto a single axis.
Colours can be customised for each data set for easier differentiation.

Comparing Laps & Sectors
Track time delta visually while watching both laps unfold frame-by-frame.
Visually compare braking zones, throttle pickups, and cornering techniques across laps or drivers.
Satellite Track Map & Overhead Car View
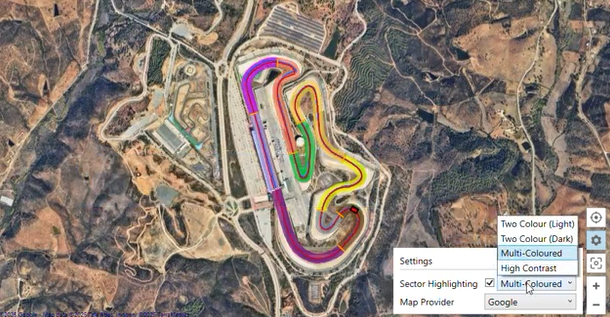
See your racing lines like never before.
Satellite imagery adds real-world context to your data, while the new Overhead Car View makes lap comparisons easier to understand.
Sector highlighting further breaks down each lap, making differences by segment easy to spot.
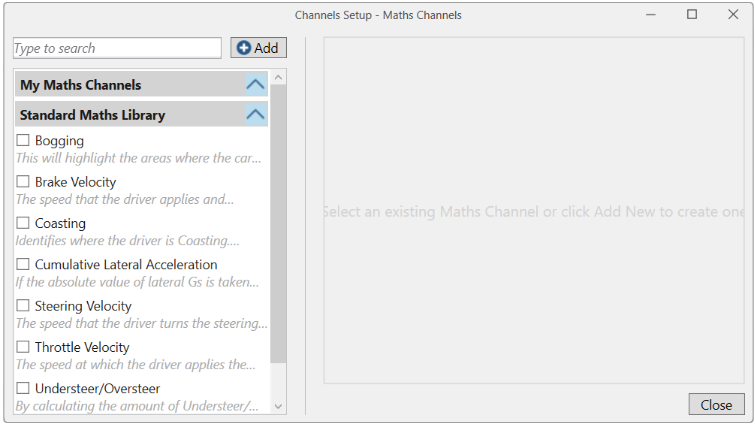
Math Channels
Build and visualise custom data with flexible maths channels, or get started quickly using our built-in library for channels such as coasting, bogging, throttle velocity and understeer /oversteer.
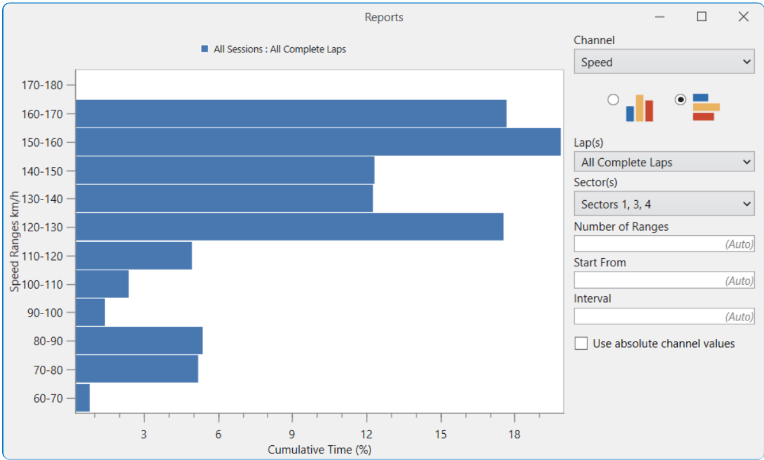
Histogram Reports
Quickly spot trends and patterns in your data with new report features designed for fast, visual analysis at a glance.
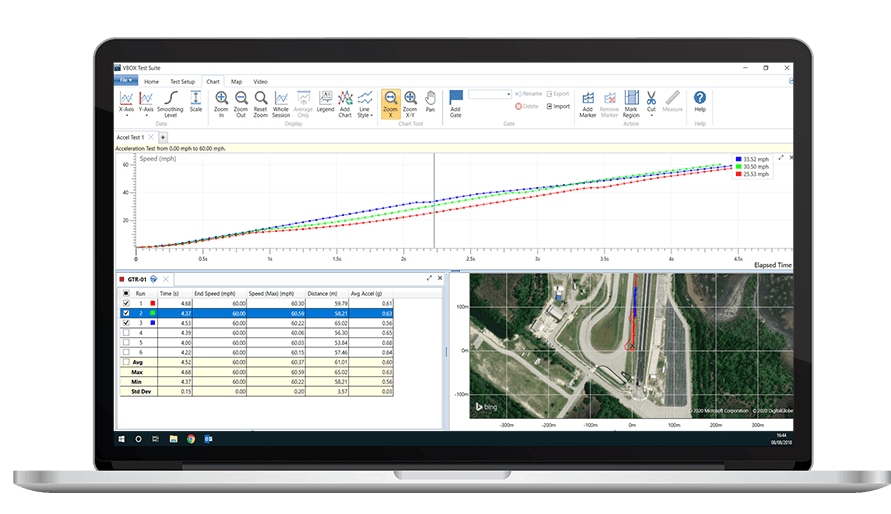
Chart Area
The chart area gives a graphical representation of the data contained within your test file, in this case three runs from a 0 to 60 mph.
Any channel (e.g. Speed against Time) can be set as X/Y axis, and multiple channels and files can be overlaid.
Track Map Position
The map area shows a positional trace from either the saved data contained within a file or real time live data.
Selecting 'Show Aerial Image/Road Map' dropdown menu will overlay either an aerial image or road map from Bing Maps onto the map area.
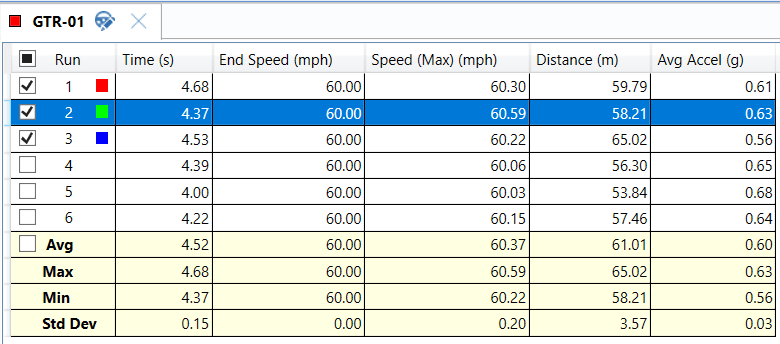
Test Result Table
What our customers say
Add-ons and Accessories
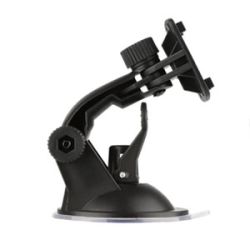
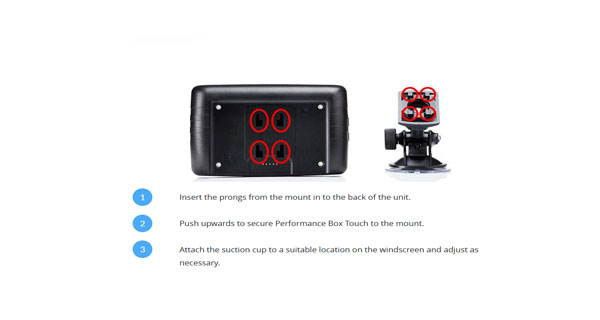
Windscreen Suction Mount
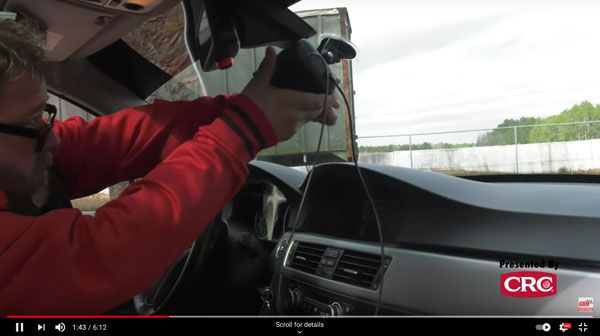
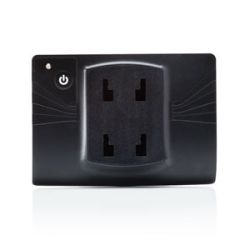
The suction mount adheres to any slick flat surface, especially glass.
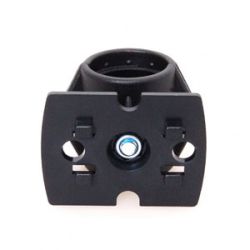
Bar Mount
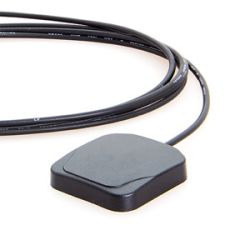
External Patch Antenna
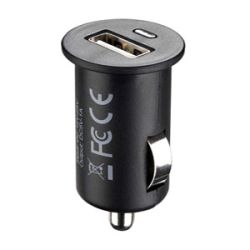
Cigar Plug USB Adapter
